How to Read an Attention Curve Like a Diagnostician
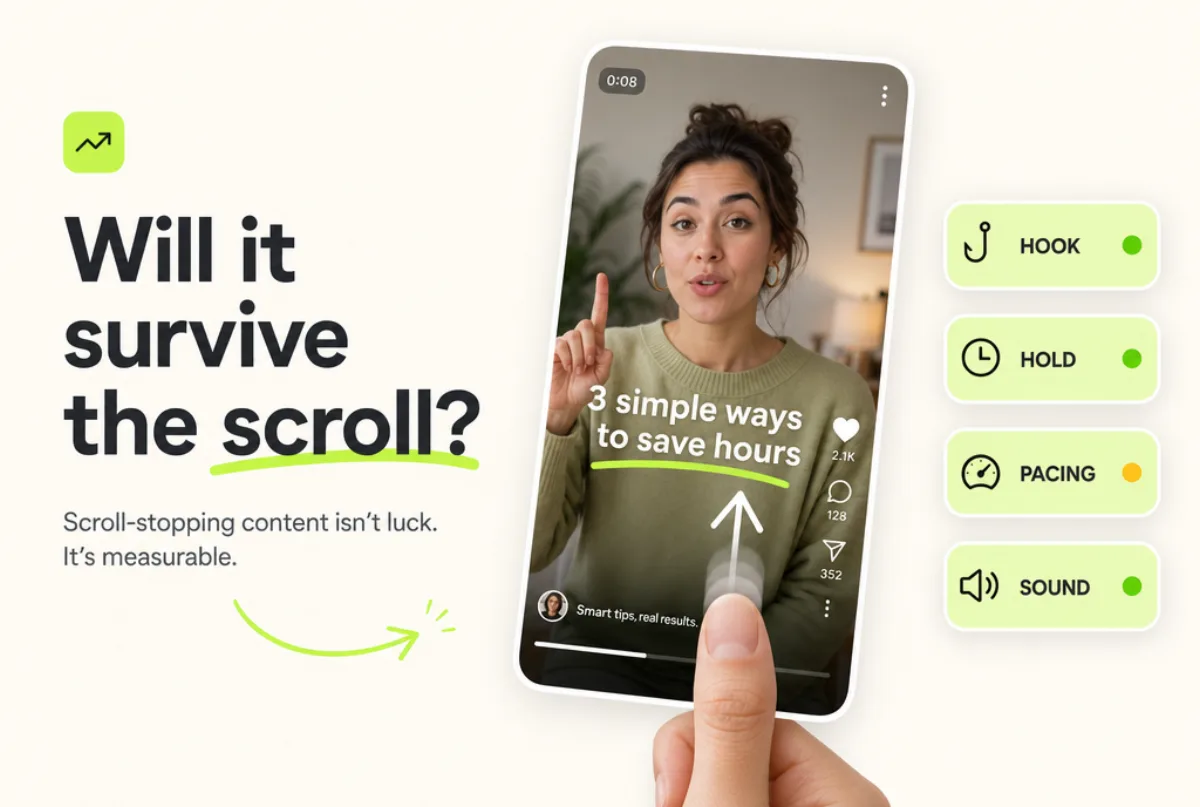
An attention curve isn't a grade — it's a second-by-second map of where a video loses its grip. Learn to read its shapes and fix the dips.
A virality number tells you whether. An attention curve tells you where — and "where" is the only thing you can edit.
TL;DR — Read the curve's shape, not its height. Find the steepest drop, name its shape, fix that one beat, re-scan.
📈 What an attention curve actually is
A line that plots how much grip a video has, second by second. Time runs left to right; height is how hard the video is pulling attention at that moment.
Two kinds exist, and confusing them causes most misreads:
- Post-publish retention graph — what your platform analytics shows after launch. Real viewers, accurate, but too late to change anything.
- Pre-publish attention curve — what Scrollproof models before anyone watches, from the clip's own visual saliency, motion, cuts, and audio.
Both are read the same way: by shape, not height.
👁️ Read the shape, not the height
This is the trap almost everyone falls into. People ask "is it high?" when the shape carries the diagnosis.
A modestly-high curve with a clean shape is healthier than a tall curve with a cliff in the first second.
Two videos can post the same average while one bleeds slowly and the other loses 60% in the opening beat. Same number, completely different problem.
Train yourself to look at slope before altitude. A fast drop is urgent no matter where it sits. A flat hold is good news no matter how high.
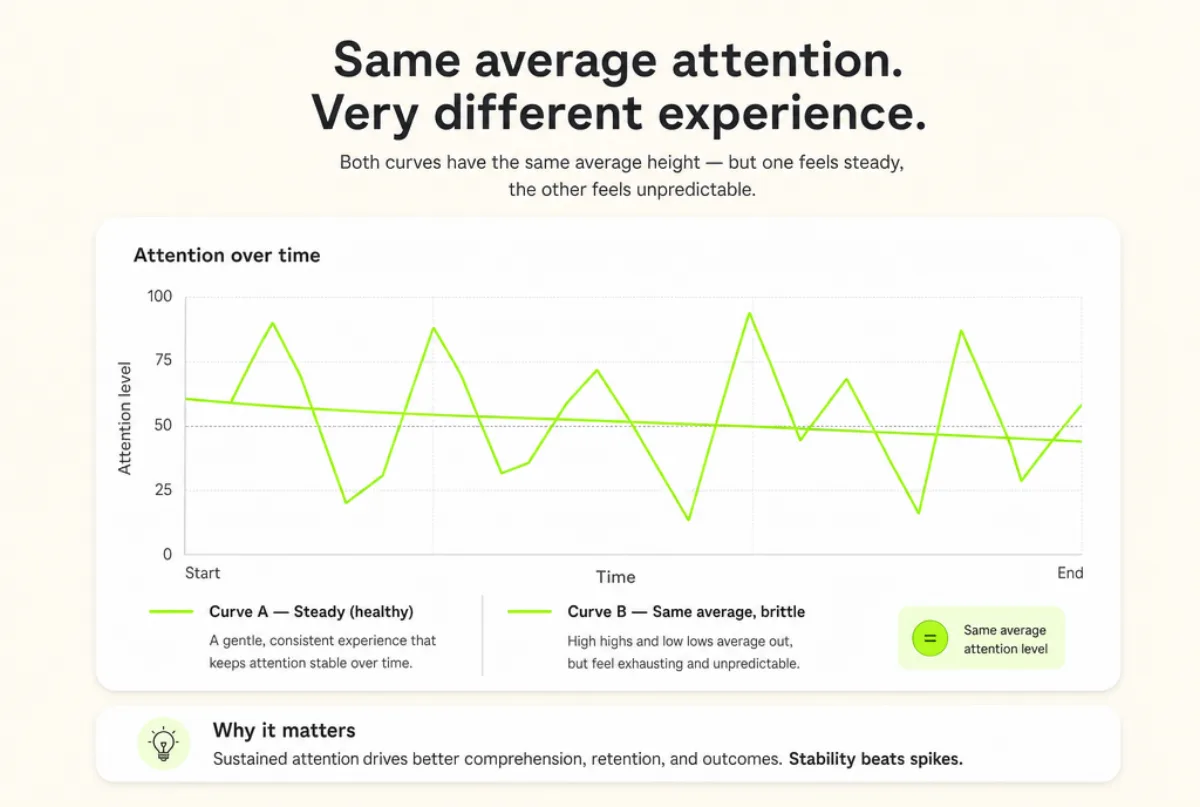 Two curves, identical average engagement — but only one has a problem you can fix.
🧠 The five shapes, and what each one means
Learning to name these on sight is most of the skill.| Shape | What it looks like | What it's telling you | Quick fix |
|---|---|---|---|
| Cliff | Steep drop right at the start | Hook problem — the open isn't holding | Rebuild the first second |
| Slow bleed | Clean start, then gentle steady decline | Hold problem — the middle thins out | Audit the spine |
| Local dip | Sudden drop at one later moment | Dead spot — a stall, tangent, or slow cut | One surgical cut |
| Recovery | A dip that climbs back up | Something pulled attention back | Steal that lever, use it earlier |
| Plateau | Long flat stretch, no rise or fall | Steady but not building | Fine if high; add a build if low |
A few notes that don't fit a table:
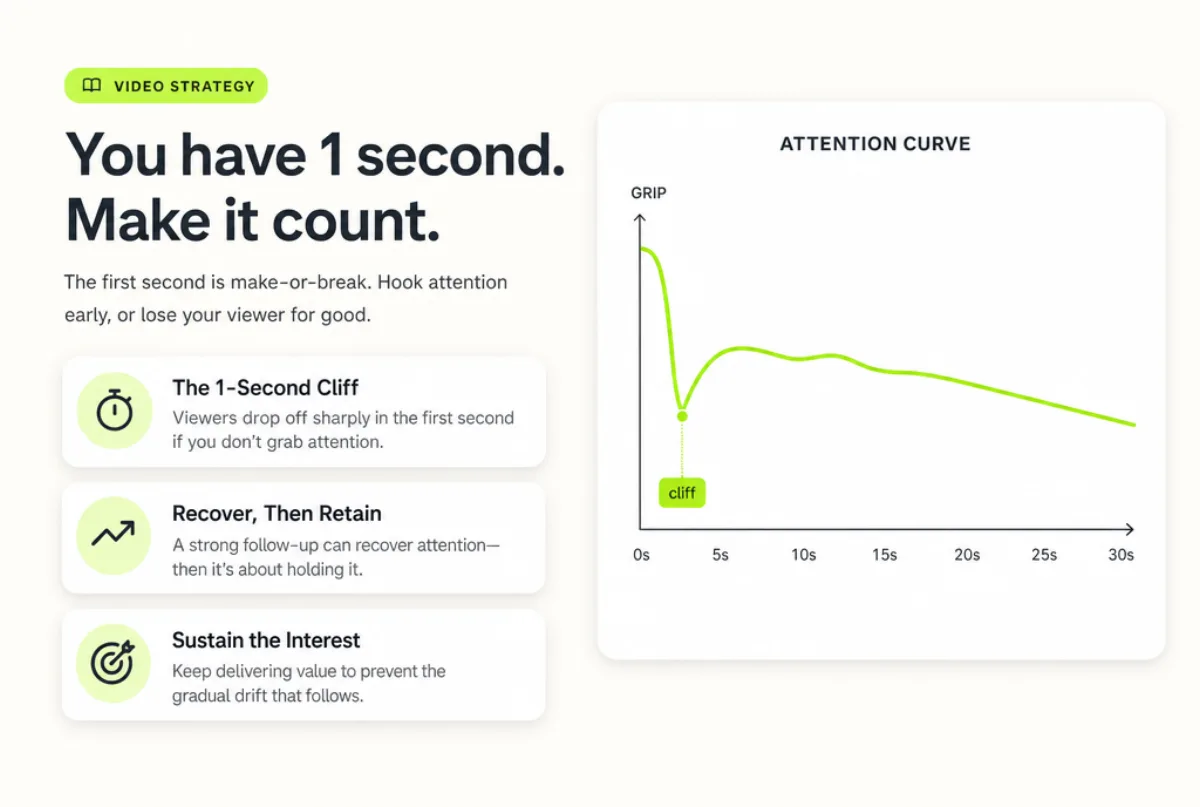
- Cliff is the most common shape and the most fixable. Most failing videos die before 3 seconds, before the content gets a fair hearing. (Fixing a weak open is the deep dive.)
- Slow bleed is the hold failing, not the hook — and no amount of hook polish stops it. That's the core of hook vs. hold.
- Local dip is the most actionable shape: it has an address. Go to that second; it's usually a pacing problem.
- Recovery is a gift — it shows what your levers are. Whatever pulled attention back works in your hands. Use it earlier and more often.
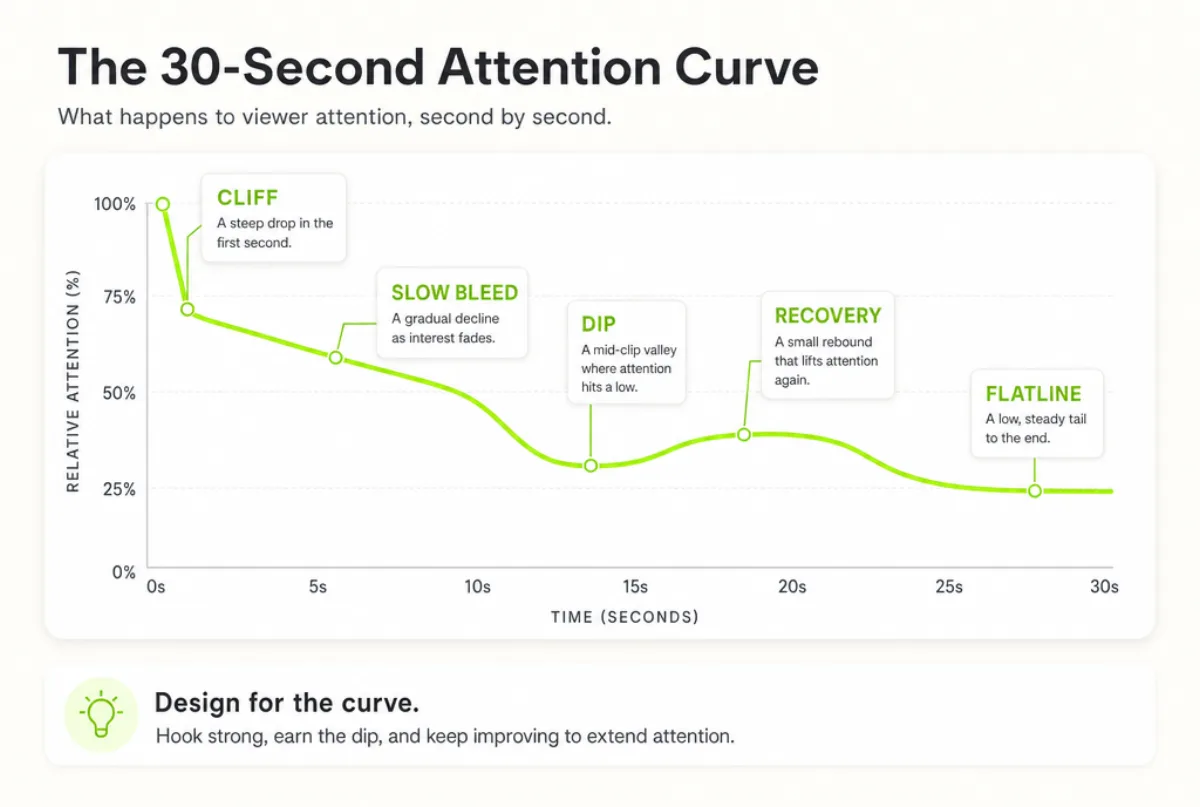 The five shapes on one curve — once you can name them on sight, the read takes seconds.
🎯 The reading order that turns a curve into a to-do list
Read in the wrong order and you'll polish the part that was already working. Use this sequence:
- Where does it drop? Find the steepest losses first. Slope, not altitude — that's your highest-leverage edit.
- What shape is the drop? Cliff, bleed, or local dip. The fixes don't transfer.
- Where does it recover? Recoveries reveal your working levers. Steal from yourself.
- Only then, the height. A sanity check, not the headline. Fix the drops and the height takes care of itself.
This converts a wiggly line into a ranked list of edits, each tied to a timestamp and a fix. It's why a curve slots naturally into a pre-publish testing workflow instead of sitting there as a vanity readout.
🔊 Why the curve dips where it does
The shape tells you where and what kind. The signals tell you why — which makes the fix obvious.
A dip is almost always one channel going quiet:
- Visual saliency falls. Flat composition, no clear subject, low contrast. How the eye decides where to look covers what wins a frame.
- Motion stalls. A static hold that runs long reads as a dead beat.
- Cuts dry up. A long, cut-free stretch lets attention settle — and settled attention drifts.
- Audio energy drops. A silence, a mumble, a flat delivery. Sound carries more retention weight than most creators credit.
When a dip lines up with two or more quiet channels at once, the edit names itself.
⚠️ A pre-publish curve is a smoke detector, not a crystal ball
Here's the honest caveat: a pre-publish curve is a model of engagement, not a recording — because no one has watched yet.
That bounds it. It's very good at finding structural problems (weak open, dead spot, flat stretch) because those live in the signal itself.
It can't know your specific topic will bore your specific audience — that's a fact about them, not the clip.
It reliably tells you where the structure is weak. It does not promise how the room will react. Both are true at once — pretending otherwise is how trust gets spent.
This is the same boundary behind what a virality score can and can't tell you.
Let the modeled curve catch structure before launch; let your real retention graph confirm it after.
When the modeled dip and the live drop-off land on the same second, you've learned something durable about your own work.
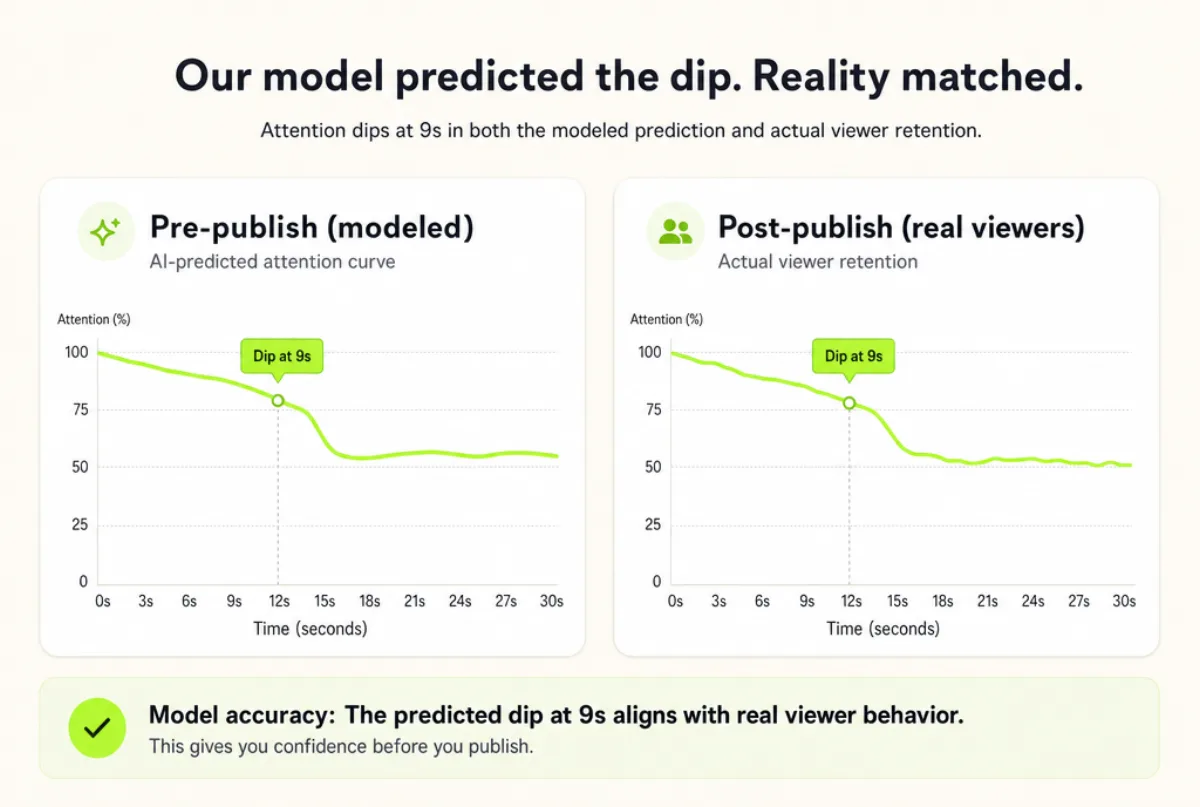 When the modeled dip and the live drop-off line up, you've found a structural truth about your own work.
✅ How to act on what the curve shows
A diagnosis is only worth the edit it produces. Translate each shape into a move:
- Cliff → rebuild the first second. Start on your strongest frame, lead with motion or an audio event, cut every frame of runway. See the first second.
- Slow bleed → audit the spine. Walk each beat: "does this advance what they came for?" Delete the ones that don't.
- Local dip → make one surgical cut. Go to the timestamp, find the stall, compress or remove it. Cheapest high-impact edit you can make.
- Recovery → industrialize what worked. Deploy that proven lever earlier and more than once.
- Low plateau → add a build. Introduce a turn, a reveal, or a pace change so the line has somewhere to climb.
Then re-scan and watch the shape change. The read-cut-rescan loop is short enough to run several times before you publish — the whole point of having the curve early.
Frequently Asked Questions
What is an attention curve?
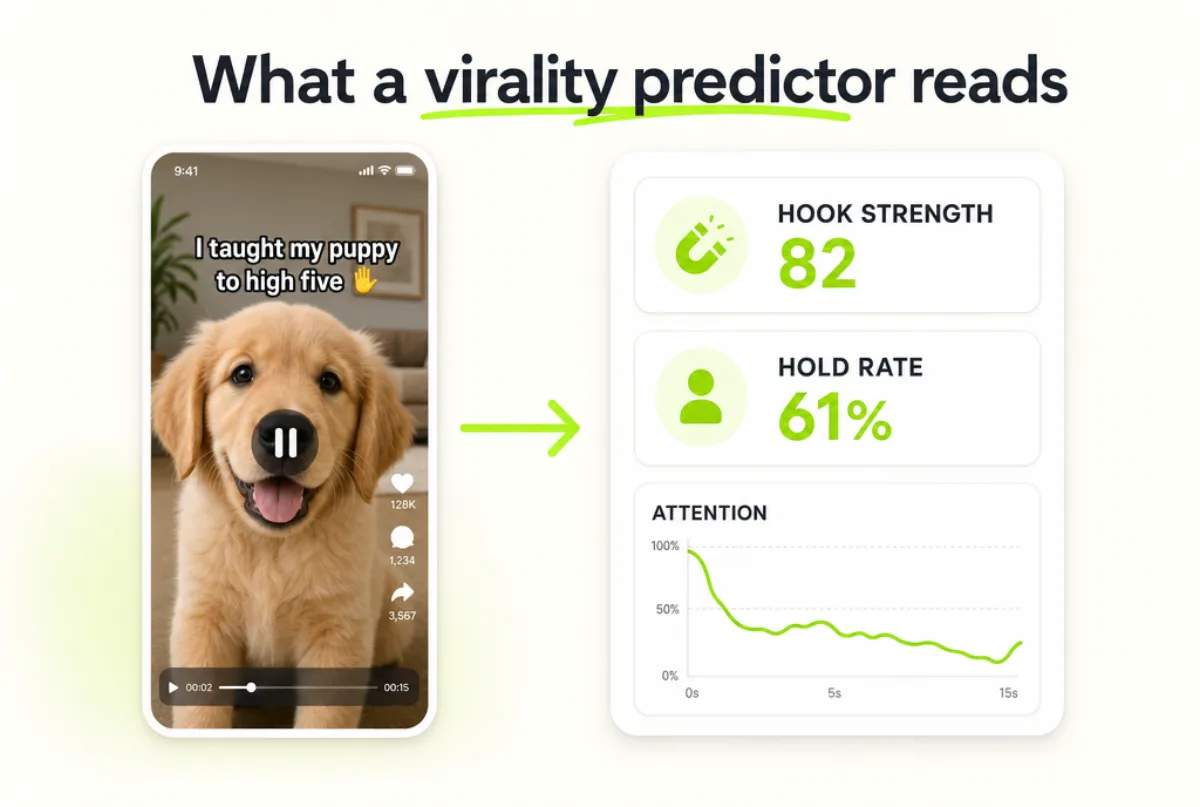
A line that plots how strongly a video holds attention at each moment. A pre-publish version (like Scrollproof's) models it from saliency, motion, cuts, and audio; a post-publish retention graph records real viewers.
Both are read by shape, not height.
What does a steep drop at the start mean?
That's a cliff — almost always a hook problem. The open didn't convert the scroll-stop into a stay.
The fix lives entirely in the first second; the rest of the video is rarely the issue.
Should I aim for a high curve or a flat curve?
A flat curve at a reasonable level beats a tall curve with a sharp drop. Height is an average that hides where you're losing people.
Read slope before altitude.Can a pre-publish curve predict how many views I'll get?
No — and any tool that claims to is overselling. A modeled curve finds structural weaknesses, but it can't know how your audience will react to your topic.
It predicts creative strength, not reach.
How do I turn a dip into an actual edit?
Go to the dip's timestamp and check which signal went quiet — frame, motion, cuts, or audio. The channel that dropped names the fix.
Make the one edit, re-scan, and watch whether the dip flattens.
The creators who get the most from a curve aren't chasing a tall line — they treat every dip as a sentence: this is where you lost them, and this is probably why.
Don't chase a tall line. Treat every dip as a sentence: this is where you lost them, and this is probably why.
Scan one free and read your first attention curve in under a minute.
Stop guessing. Scan the clip.
Drop a short video and get Hook Strength, Hold Rate, a second-by-second attention curve, and a real attention heatmap — in about a minute. First scans are free.